Data and model-assisted beekeeping
Gregory Zacharewicz, IMT Mines Alès – Institut Mines-Télécom and Baptiste Magnier, IMT Mines Alès – Institut Mines-Télécom
Bees are key participants in biodiversity. They contribute enormously to pollination, an essential step in the life cycle of plants. Yet current threats to biodiversity herald the disappearance of pollinating insects and honey bees in particular (such as the Apis mellifera in Europe). This loss would be catastrophic for humans, since an estimated 35% of our food relies on pollination services from bees!
Colony Collapse Disorder (CCD), in which bees systematically leave their hives, has become recurrent in honey bee colonies. A significant drop in bee colonies has been reported worldwide and could lead to the loss of 90% of hives. For honeybees, this phenomenon can be caused by toxicological, parasitic, viral or even predatory factors, with the spread of the Asian hornet (Vespa velutina) and the Oriental hornet (Vespa orientalis) throughout France in recent years.
By raising bees, beekeepers play a key role in protecting the species. They now have access to less invasive solutions to help them monitor and predict the health of their hives. This article specifically focuses on two of our studies, which use the Internet of Things (IoT) associated with artificial intelligence and combined with computer models and simulations aimed at assisting beekeepers with their practices.
Bee behavior at hive entrances
The first key to monitoring and predicting a hive’s health is the modeling of bee behavior. This helps identify the strengths and weaknesses caused by diseases, famine or predators. This allows us to understand what is going on inside the hive by observing what happens outside. Images and video provide a valuable and non-destructive source of information with the potential of contributing to science and ecology. However, trajectory modeling had not yet been developed. This is what motivated our work.
Our initial research therefore focused on detecting bees and modeling their trajectories. The idea was to record bee trajectories individually and then characterize the overall pace of activity in front of the hive in order to make observations that will be consolidated and made available to scientists to be crossed-checked with bee data (famine, predators, drought, etc.).
In practice, the goal was to record the movement of bees with a fixed, non-invasive camera, filming the insects’ entrances and exits. Image processing techniques using a sensor with high resolution and capture frequency isolate the bee from its background.
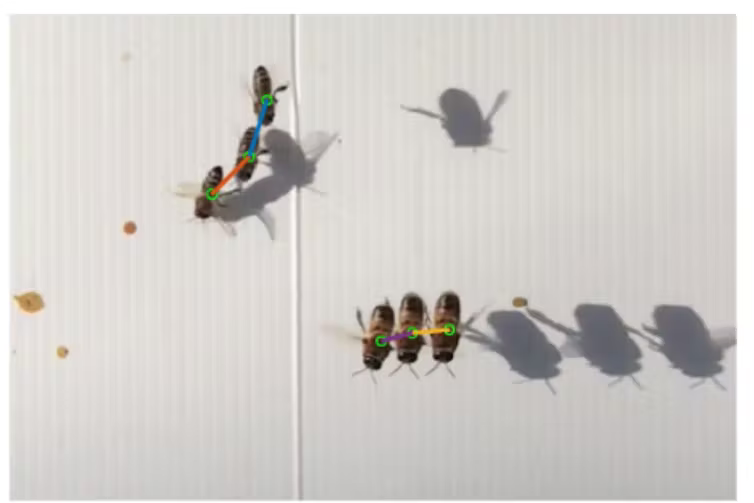
Figure 1: Center of the body (green dot) and movements (red, blue, purple, and yellow line) of two bees, calculated from several images. Baptiste Magnier, Gregory Zacharewicz, provided by the author.
The bee counters are then extracted from each video frame and used to identify the center of each bee (green dots on the bees in figure 1). Next, each bee’s orientation is represented by an ellipse (based on the bee’s shape). The orientation and size of the ellipses in the image are used to calculate the bees’ movements between the different frames in the video (blue and red lines for bee 1 and yellow and purple lines for bee 2)..

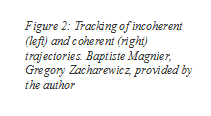
These objects of constant size and orientation are easier to track in the videos than deformable objects. This technique also avoids confusing the bees and calculating outlier trajectories, as shown in Figure 2.
Various trajectories are therefore recorded. Figure 3 shows the results from a video containing 1,755 frames. It illustrates the trajectories of the bees entering (green), leaving (red) and passing in front of the hive (blue). Poorly identified trajectories are also shown in blue. These data are then used to study and classify the bees’ behavior.
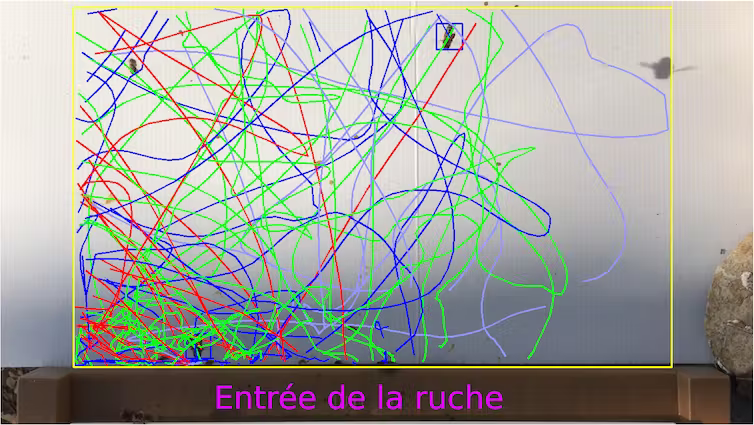
Figure 3: Tracking of the bees’ trajectories in front of the hive, compiled from 1,755 images. Green lines: bees entering the hive; red lines: bees leaving the hive; blue lines: bees passing in front of the hive and poorly identified trajectories. Baptiste Magnier, Gregory Zacharewicz, provided by the author
In the future, bees’ behavior will be able to be interpreted in greater detail by supplementing the study with machine learning and a semi-supervised AI method.
Physical characteristics of the hive
The second decision support tool for beekeepers is an internal hive health analysis. For this part of the research, our team used connected scales combined with data from several sensors (relative humidity and internal temperature) to analyze variations in each hive’s weight and videos of landing board activity (like those presented above).
The BeePMN project–led by our team in partnership with USEK in Lebanon, ConnectHive in France and the Honey Workshop in Lebanon–contributes to the physical characterization of a hive’s state based on data from shared databases. We proposed a methodology based on the recognition of characteristic patterns in the weight data recorded by a hive scale. A pattern could be an increase in weight followed by a plateau and then a drop linked to a departure of bees (by swarming for example).
The data collected is then assessed and processed using algorithms, which reveal recurring patterns associated with the events occurring in the hive.
Connected beekeepers
Together with other data, these two examples may eventually be integrated into a generalized hive tracking system. Computer models (shown in Figure 4) are generated automatically through a series of predefined alerts, which prompt the beekeeper to take action. This could include informing the beekeeper of a need to feed the bees, triggered by a drop in weight below the reference value during a particular period in autumn or winter.
In practice, since beekeeping tasks cannot be automated and human intervention is required, the proposed system will simply assist and guide beekeepers in planning and performing several relevant tasks with greater precision: breeding and reproducing new colonies, feeding the colonies, adding honey supers (top part of hive used to harvest honey), scheduling health operations, controlling parasites (such as varroa mites), and scheduling operations such as hibernation. This helps beekeepers monitor their colonies, perform routine tasks, respond to alerts in the event of any disorders, and predict their future supply needs.
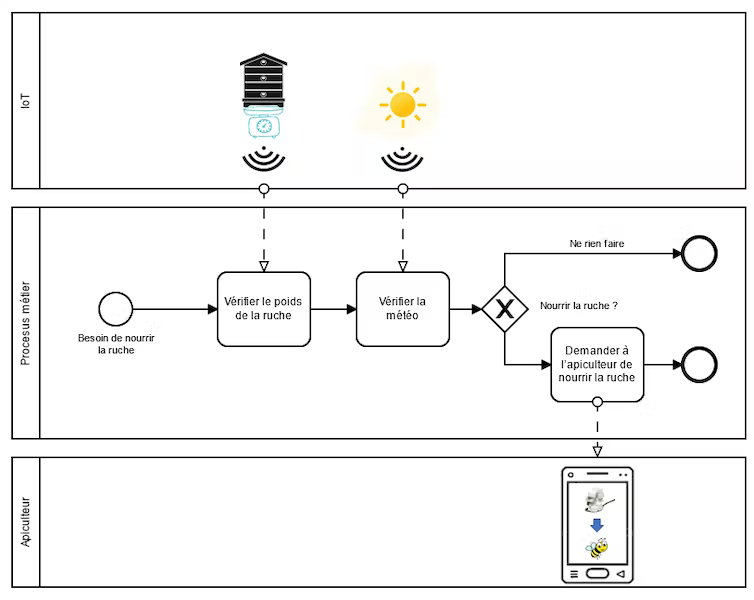
Figure 4: Hives, sensors, AI and smartphones/tablets form a comprehensive tracking system. Gregory Zacharewicz, Baptiste Magnier, provided by the author
These models are based on beekeeping rules established with the help of experts. There are also plans to adapt these rules over time based on contributions from the community of beekeepers using the system.
Finally, this will all be organized and presented via a user-friendly interface for smartphones or tablets, based on gamification principles.
This contribution will improve the beekeeping experience for amateurs and professionals by reducing operational risks for the hives and creating the possibility of integrating additional data (detailed weather phenomena, flower maps, humidity, bee colony behavior, etc.) to expand the capabilities of the simulations. Finally, the latest digital advances in simulation should pave the way for more precise beekeeping practices in order to minimize the use of invasive and synthetic treatments.
Gregory Zacharewicz, Professor at Institut Mines Télécom, IMT Mines Alès – Institut Mines-Télécom and Baptiste Magnier, Associate professor at IMT Mines Alès – Institut Mines-Télécom
This article has been republished from The Conversation under a Creative Commons license. Read the original article (in French).


Leave a Reply
Want to join the discussion?Feel free to contribute!