Cybersecurity: Detect and Conquer
Researchers from Université Paris-Saclay members are developing algorithms and visual tools to help detect and counteract cybersecurity failures.
You can’t fight what you can’t see. The protection of computer systems is a growing concern, with an increasing number of smart devices gathering our private data. Computer security has to cover hardware as well as software vulnerabilities, including network access. It needs to offer efficient countermeasures.But the first step to cybersecurity is to detect and identify intrusions and cyberattacks.
Usual attacks have adverse effects on the availability of a service (Denial of Service), try to steal confidential information or to compromise the service’s behavior by modifying the flow of events produced during an execution (that is, adding, removing or modifying events). They are difficult to detect in a highly distributed environment (like the cloud or e-commerce applications), where the order of the observed events is partially unknown.
Researchers from CentraleSupélec designed a new approach to tackle this issue. They used an automaton, modeling the correct behavior of a distributed application, and a list of temporal properties that the computation must comply with in any execution (“is always or never followed by”, “always precede”, etc.). The automaton is then able to generalize the model from a finite (thus incomplete) set of behaviors. It also avoids introducing incorrect behaviors in the model in the learning phase. Combining these two types of methods (automaton and list), the team managed to lower the rate of false positives (down to 2% in certain cases) and the mean time necessary to detect an intrusion (less than one second).
Another team from the same UPSaclay member chose a different approach. Researchers designed an intuitive visualization tool that helps to easily and automatically manage security alerts. Cybersecurity mechanisms raise large quantities of alerts, many of them being false-positive. VEGAS, for “Visualizing, Exploring and Grouping AlertS”, is a customizable filter system. It offers the front-line security operator (in charge of dispatching the alerts to security analysts) a simple 2D representation of the original dataset of alerts they receive. Alerts that are close in the original dataset are still close in the computed representation, while alerts that are distant stay distant. The officer can then select alerts that visually appear to belong to the same group, i.e. similar alerts, to generate a new rule to be inserted in the dispatching filter. That way, the amount of alerts the front-line security operator receives is reduced and security analysts only get the alerts they need to investigate further.
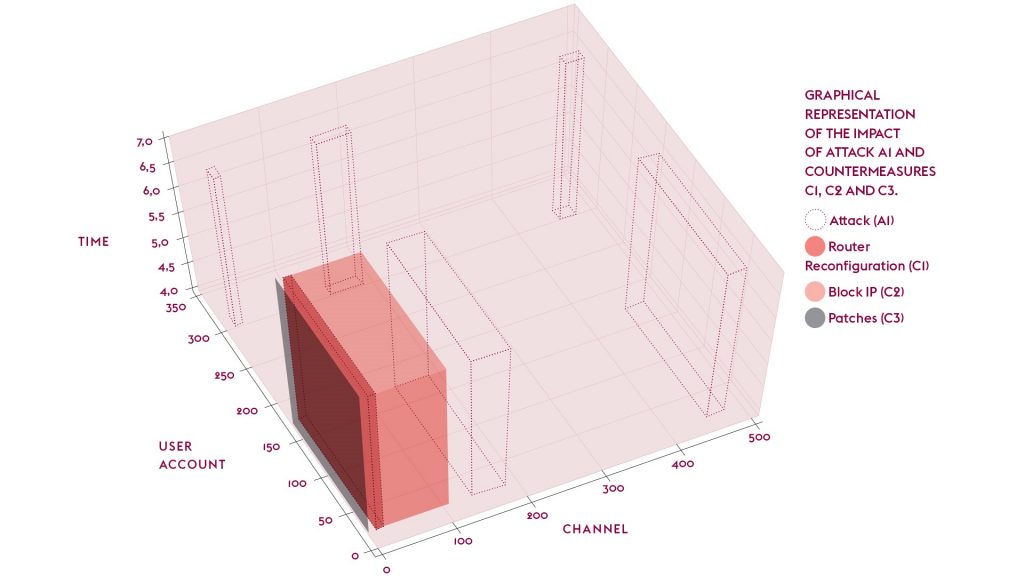
Those analysts could then use another visualization tool developed by a team from CNRS and Télécom SudParis to calculate the impact of cyber attacks and security countermeasures. Here, systems are given coordinates in multiple spatial, temporal and context dimensions. For instance, in order to access a web-server (resource) of a given organization, an external user (user account) connects remotely (spatial condition) to the system by providing their login and password (channel) at a given date (temporal condition).
In this geometrical model, an attack that compromises some resources using a given channel will be represented as a surface (square or rectangle). If it also compromises some users, it will be a parallelepiped. On the contrary, if we only know which resources are compromised, the attack will only affect one axis of the representation and be a line.
“Cybersecurity mechanisms raise large quantities of alerts.”
Researchers then geometrically determine the portion of the service that is under attack and the portion of the attack controlled by a given security measure. They can automatically calculate the residual risk (the percentage of the attack that is left untreated by any countermeasure) and the potential collateral damage (the percentage of the service that is not under attack but is affected by a given countermeasure). Such figures allow security administrators to compare the impact of multiple attacks and/or countermeasures in complex attack scenarios. Administrators are able to measure the size of cyber events, identify vulnerable elements and quantify the consequences of attacks and measures.
But what if the attack takes place directly in the hardware? Indeed, when outsourcing their circuits, companies can not be assured that no malicious circuit, such as a hardware trojan horse, has been introduced. Researchers from Télécom ParisTech proposed a metric to measure the impact of the size and location of a trojan: using this metric, there is a probability superior to 99% (with a false negative rate of 0.017%) of detecting a hardware trojan bigger than 1% of the original circuit.
More recently, the same team designed a sensor circuit to detect “electromagnetic injection”, an intentional fault injection utilized to steal secret information hidden inside integrated circuits. This sensor circuit has a high fault detection coverage and a small hardware overhead. So maybe you can fight what you can’t see, or at least you can try to. You just have to be prepared!
References
Gonzalez-Granadillo et al. A polytope-based approach to measure the impact of events against critical infrastructures. Journal of Computer and System Sciences, Volume 83, Issue 1, February 2017, Pages 3-21
Crémilleux et al. VEGAS: Visualizing, exploring and grouping alerts. NOMS 2016 – 2016 IEEE/IFIP Network Operations and Management Symposium, Istanbul, 2016, pp. 1097-1100
Totel et al. Inferring a Distributed Application Behavior Model for Anomaly Based Intrusion Detection. 2016 12th European Dependable Computing Conference (EDCC), Gothenburg, 2016, pp. 53-64
Miura et al. PLL to the rescue: A novel EM fault countermeasure. 2016 53nd ACM/EDAC/IEEE Design Automation Conference (DAC), Austin, TX, 2016, pp.
[divider style=”normal” top=”5″ bottom=”5″]
The original version of this article has been published in l’Édition of l’Université Paris Saclay.


Leave a Reply
Want to join the discussion?Feel free to contribute!