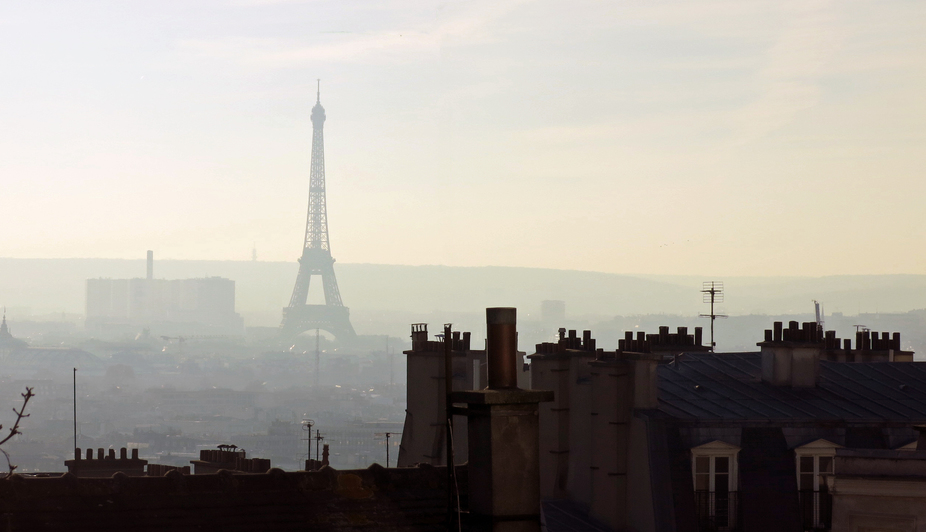
Fine particles are dangerous, and not just during pollution peaks
Véronique Riffault, IMT Lille Douai – Institut Mines-Télécom and François Mathé, IMT Lille Douai – Institut Mines-Télécom
[divider style=”normal” top=”20″ bottom=”20″]
[dropcap]T[/dropcap]he French Agency for Food, Environmental and Occupational Health and Safety (ANSES) released a new notice concerning air pollution yesterday. After having been questioned on the potential changes to norms for ambient air quality, particularly concerning fine particles (PM10 and PM2.5), the organization has highlighted the importance of pursuing work on implementing long-term public policies that promote the improvement of air quality. They recommend lowering the annual threshold value for PM2.5 to equal the recommendations made by the WHO, and introducing a daily threshold value for this pollutant. As the following data visualization shows, the problem extends throughout Europe.
Average concentrations of particulate matters whose aerodynamic diameter is below 2.5 micrometers (called “PM2.5” which makes up “fine particles” along with PM10) for the year 2012. Amounts calculated using measures from fixed air quality monitoring stations, shown in micrograms per m3 of air. Data source: AirBase.
The level reached in peak periods is indicated by hovering the mouse over a given circle, the sizes of which will vary depending on the amount. The annual average is also provided, detailing long-term exposure and the subsequent proven impact on health (particularly on the respiratory and cardio-vascular systems). It should be noted that the annual target value for the particles (PM2.5), as specified by European legislation is currently 25 µg/m3. The level will drop to 20 µg/m3 in 2020, whilst the WHO currently recommends an annual threshold of 10 µg/m3.
The data shown on this map correspond exclusively to a so-called “fundamental” site typology, examining not only urban environments but also rural ones, which are far from being influenced by nearby pollution (coming from traffic or industry). Airbase also collects data supplied by member states that use measuring methods that can vary depending on the site but always respect the data quality objectives and are specific to the pollutant (90% of data on PM2.5 is approved annually, with an uncertainty of ± 25%). This perhaps explains why certain regions show little or no data (Belarus, Ukraine, Bosnia-Herzegovina and Greece), keeping in mind that a single station cannot be representative of the air quality across an entire country (as is the case in Macedonia).
The PM2.5 shown here may be emitted directly into the atmosphere (these are primary particles) or formed by chemical reactions between gaseous pollutants in the atmosphere (secondary particles). The secondary formation of PM2.5 often stems from peaks in pollution at certain points in the year when the sources of the pollutants are most significant and in meteorological conditions which allow them to accumulate. Sources connected to human activity are mainly linked to combustion processes (such as engines in vehicles or the burning of biomass and coal for residential heating systems) and agricultural activity.
The above map shows that the threshold suggested by the WHO has been surpassed in a large majority of stations, particularly in Central Europe (Slovakia, South Poland) due to central heating methods, or in Northern Italy (the Po Valley), which has been affected by poor topographical and meteorological conditions.
Currently, only 1.16% of stations are recording measurements that are still within the WHO recommendations for PM2.5 (shown in light green on the map). On top of this, 13.6% of stations have already reached the future European limits to be set in 2020 (shown in green and orange circles).
This illustrates that a large section of the European population is being exposed to concentrations of particles that are harmful to health and that some significant efforts are to be made. In addition, when considering that the mass concentration of particulates is a good indicator of air quality, their chemical composition should not be forgotten. This is something which proves to be a challenge for health specialists and policymakers, especially in real time.
Véronique Riffault, Professor in Atmospheric Sciences, IMT Lille Douai – Institut Mines-Télécom and François Mathé, Professor-Researcher, President of the AFNOR X43D Normalization Commission “Ambient Atmospheres”, Head of Studies at LCSQA (Laboratoire Central de Surveillance de la Qualité de l’Air), IMT Lille Douai – Institut Mines-Télécom
The original version of this article was published in French in The Conversation France.


Leave a Reply
Want to join the discussion?Feel free to contribute!